Teacher Planner & Gradebook in Google Sheets: Weighted Grades Explained
A weighted grade means each category of assignment — tests, homework, participation — counts for a fixed percentage of the final grade regardless of how many individual assignments are in that category, and a spreadsheet gradebook calculates it automatically once you assign the weights. Download the free Lite version or the full Teacher Planner & Gradebook to get weighted grading, attendance tracking, a class schedule, and a performance dashboard in one Google Sheets file.
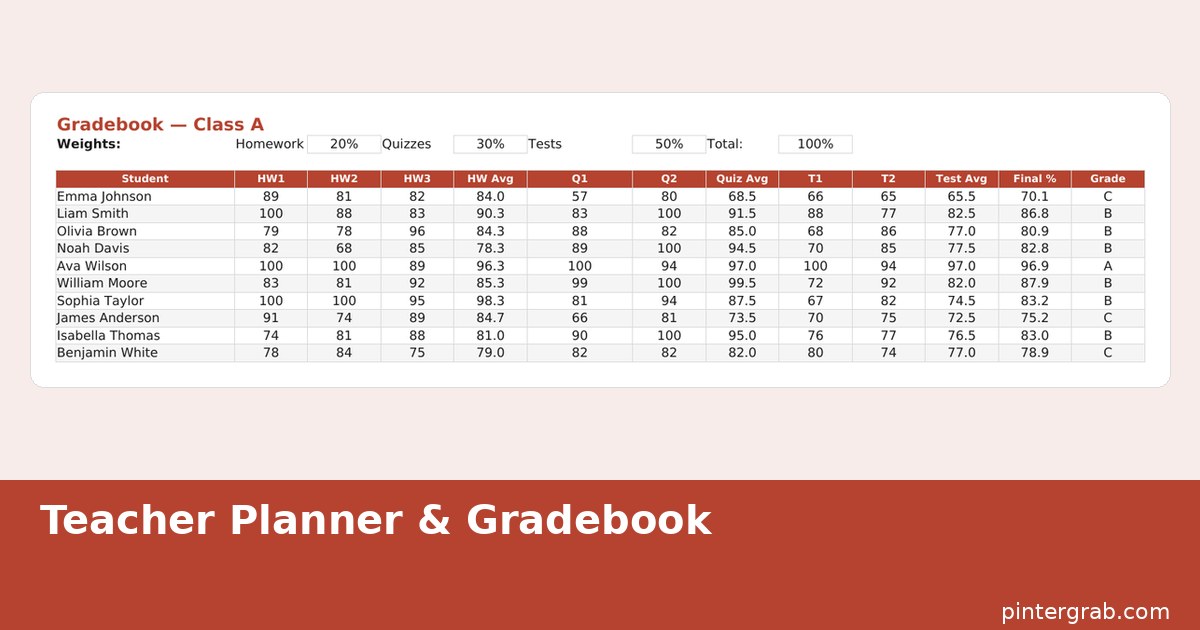
What weighted grading actually means, with numbers
Say a class is graded 40% tests, 30% homework, 20% participation, and 10% projects. A student who averages 90% on tests, 85% on homework, 100% on participation, and 70% on projects does not get a simple average of those four numbers (which would be 86.25%). Instead, each average is multiplied by its category's weight and the results are summed: (90 × 0.40) + (85 × 0.30) + (100 × 0.20) + (70 × 0.10) = 36 + 25.5 + 20 + 7 = 88.5%. The categories that count for more of the final grade pull harder on the result, which is the entire point of weighting — a strong test average should matter more than a single easy homework category if tests are worth four times as much.
What's inside the gradebook
Beyond the weighted grade calculation itself, the sheet includes an attendance tracker with daily present/absent/tardy marking and a running percentage per student, a class schedule tab for keeping periods and room assignments straight across multiple classes, and a performance dashboard that surfaces which students are trending down before report cards make it official. Categories, weights, and the number of assignments per category are all editable — the sheet is not locked to one grading philosophy.
Setting up categories and weights correctly
- Download the file from the Teacher Planner page and open it in Google Sheets or Excel.
- On the setup section of the Gradebook tab, list your grading categories (Tests, Homework, Participation, Projects, or your school's actual categories).
- Assign a weight percentage to each category — the four numbers must add up to exactly 100%, or the final grade calculation will be off by however much the total is over or under.
- Enter individual assignment scores under each category as the term goes on; the sheet averages within a category automatically before applying the weight.
- Check the calculated final grade column against a couple of students by hand early in the term, just to confirm your weights are set up the way your school's policy actually requires.
Why attendance sits next to grades, not in a separate file
Attendance and performance are usually connected — a student's grade dip often lines up with a stretch of absences, and that pattern is easy to miss when attendance lives in one system and grades live in another. Keeping both on the same dashboard means a quick glance shows whether a falling average is a grading issue or an attendance issue, which changes what conversation you have with the student or their family. The tracker marks present, absent, or tardy per day and rolls it into a running attendance percentage per student, updated the same way the grade average is.
Spreadsheet gradebook vs. a school LMS vs. a paper gradebook
| Option | Cost | Customizable weighting | Works for a personal tutoring business | Setup time |
|---|---|---|---|---|
| This spreadsheet | Free Lite, paid Pro | Fully — any categories, any weights | Yes, no institutional account needed | 10–15 minutes |
| School LMS (PowerSchool, etc.) | Provided by school | Set by school policy, often locked | No — tied to the institution | None, but limited control |
| Paper gradebook | $5–15 | Manual math for every weighted average | Yes | None, but slow per-student math |
A school LMS is mandatory for official grades in most districts, so this gradebook is not meant to replace it — it is the tool for tutors, private teachers, substitute teachers tracking their own notes, or any teacher who wants to see trends and run "what if this student gets an 80 on the final" scenarios before entering anything official.
Common mistakes with weighted grading
- Weights that don't sum to 100%. The single most common error — four categories at 40/30/20/15 add up to 105%, which silently inflates every student's final grade. Add your weight percentages up by hand once before trusting the sheet.
- Mixing point-based and percentage-based entry in the same category. If one test is out of 100 points and another is out of 50, enter both as percentages (or make sure the sheet's averaging accounts for different point totals) rather than averaging raw points directly.
- Forgetting a late or missing assignment counts as a zero. An empty cell and a zero produce very different averages — decide up front how missing work is handled and be consistent across students.
- Changing weights mid-term. If you adjust a category's weight partway through, grades calculated earlier in the sheet may not reflect the same standard as grades calculated after the change — recalculate everyone consistently if you change the setup.
Using the dashboard to catch problems early, not at report cards
The performance dashboard's real value is timing: seeing that a student's average has dropped eight points over three weeks in week four of a term gives you time to talk to them or their family before the grade is locked in on an official report card. The same view built only at the end of a grading period is just a postmortem — the dashboard is worth checking every week or two specifically because it is cheap to glance at and expensive to ignore.
FAQ
Do the category weights have to add up to exactly 100%?
Yes. If they add up to more or less than 100%, every student's calculated final grade will be proportionally too high or too low, even though the individual category averages are correct.
Can I use this for multiple classes or class periods?
Yes — duplicate the Gradebook tab (right-click the tab > Duplicate in Google Sheets) once per class, and use the separate Class Schedule tab to keep periods and rooms straight across all of them.
Does it work for standards-based grading instead of weighted categories?
The built-in structure is weighted-category based. Standards-based grading uses a different model entirely (mastery levels per standard rather than percentage weights), so this sheet is not a direct fit for that grading style without significant rework.
Is this a replacement for my school's official grading system?
No — treat it as a personal working copy for planning and spotting trends. Your school's LMS remains the system of record for official grades.
Built with AI assistance, every formula hand-checked.
Need a planner for your own schedule outside the classroom? The Printable 2027 Planner guide covers months, weeks, and daily logs the same way this gradebook covers classes. Tracking rental income on the side? The Rental Property Tracker guide uses the same kind of automatic status calculation, just for rent instead of grades.
Frequently asked questions
Do the category weights have to add up to exactly 100%?
Yes. If they add up to more or less than 100%, every student's calculated final grade will be proportionally too high or too low, even though the individual category averages are correct.
Can I use this for multiple classes or class periods?
Yes — duplicate the Gradebook tab (right-click the tab > Duplicate in Google Sheets) once per class, and use the separate Class Schedule tab to keep periods and rooms straight across all of them.
Does it work for standards-based grading instead of weighted categories?
The built-in structure is weighted-category based. Standards-based grading uses a different model entirely (mastery levels per standard rather than percentage weights), so this sheet is not a direct fit for that grading style without significant rework.
Is this a replacement for my school's official grading system?
No — treat it as a personal working copy for planning and spotting trends. Your school's LMS remains the system of record for official grades.